Youtube and Predictive Modeling
Like most of the world, I have been in quarantine since early March. And I don’t know about anybody else, but I found myself craving human interaction. I got bored with Netflix, Hulu, and Amazon Prime. I wanted something a little more personal. Scrolling through Facebook one day, I saw a youtuber who had posted some of his youtube videos on Facebook, and I was hooked. During this quarantine, I have started subscribing to multiple youtubers, and began following their videos and channels. This is what led me to my project. How much money did these youtubers usually make? And what would they make this year?
Were their numbers through the roof due to the quarantine? Were there more people like me that found themselves craving human interactions, and youtube videos seemed to be the thing that made them feel better? Could I write a model that would predict youtubers salary?
I started my research by looking for some data on youtubers. I found a great data set on Kaggle.com about 2019 youtube salaries, and after some wrangling, got some neat information to feed into my model.
First thing I noticed looking at the data, was that there was a huge skew in the numbers, with large outliers. So I knew to build a good model I would need to drop these. So any youtuber that made $0, I dropped from my database with my data wrangling code.
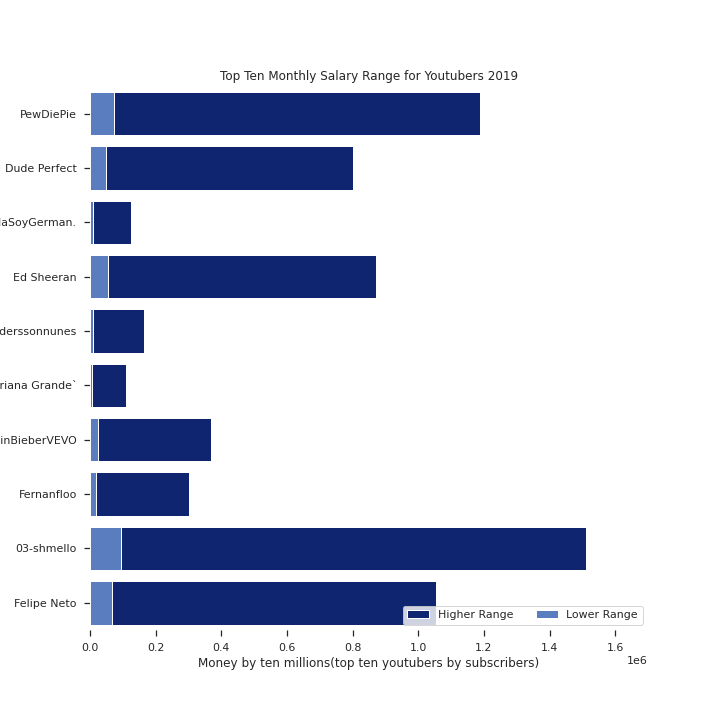
Even within just the monthly values, you can see the huge difference. But that is part of what drew me to this subject. With, what seems like, most of the U.S., if not the world, at home, Youtuber’s are putting out more content than ever. If these are the kinds of numbers that are being put out in 2019, what kind of salaries, will they be looking at this year?
Going into this, I will admit, I never realized how difficult models that predict monetary values could be. It was great experience, but I would say, that I definitely would love to spend more time learning the ends and outs of monetary predictive models.
The first thing I had to do with my data, was convert the salary ranges from Euros, to Dollars, and from ranges, to separate columns. I wrote a function to accomplish this, as well as dropping a few columns that would negatively impact my model, and setting my index, or the position of my rows, to the names of my youtubers. This would allow me to be able to know who my predictions were for, without going back to the original dataset.
After lots of road blocks, and a ton of models, I finally found a Forrest Regression model that worked okay for me. I have a 48% accuracy, with 52% percent deficit. On average, my model was within $23965.31 of the real numbers. While this seems quite high, considering some YouTuber’s are earning millions every year, I felt quite confident in my model and it’s ability to perform.
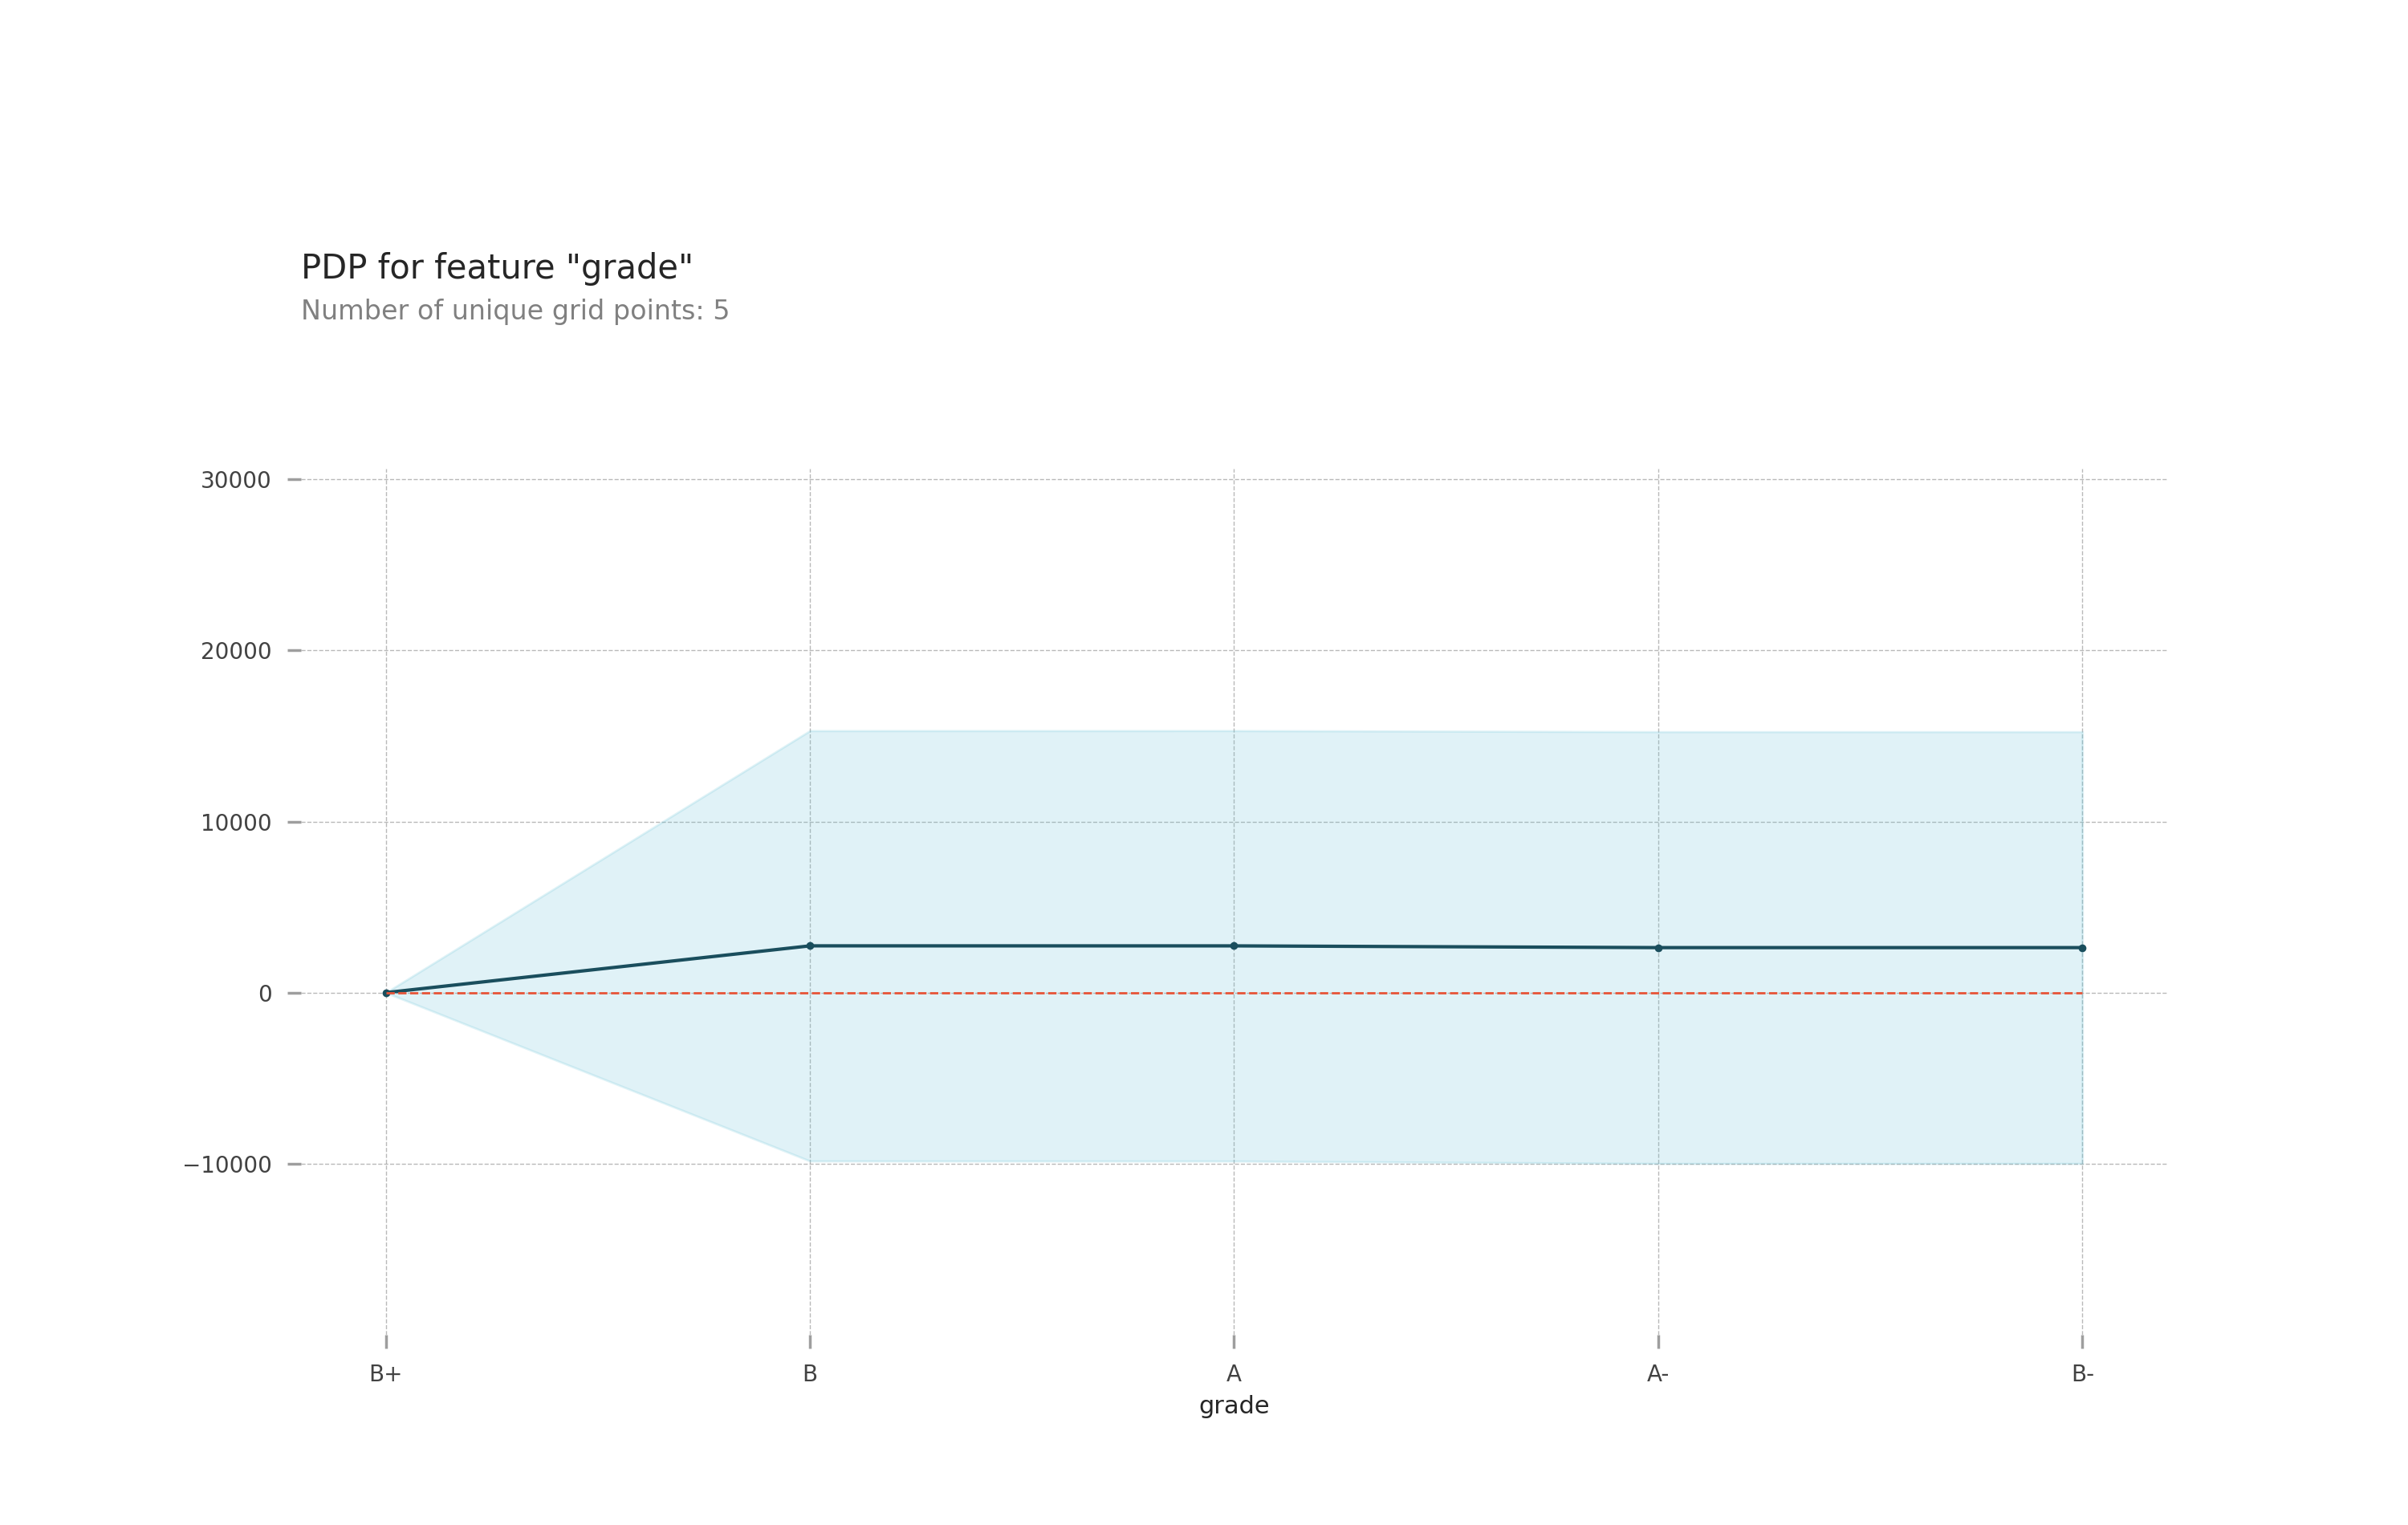
Interestingly enough, the most important features in my model weren’t what I was expecting.
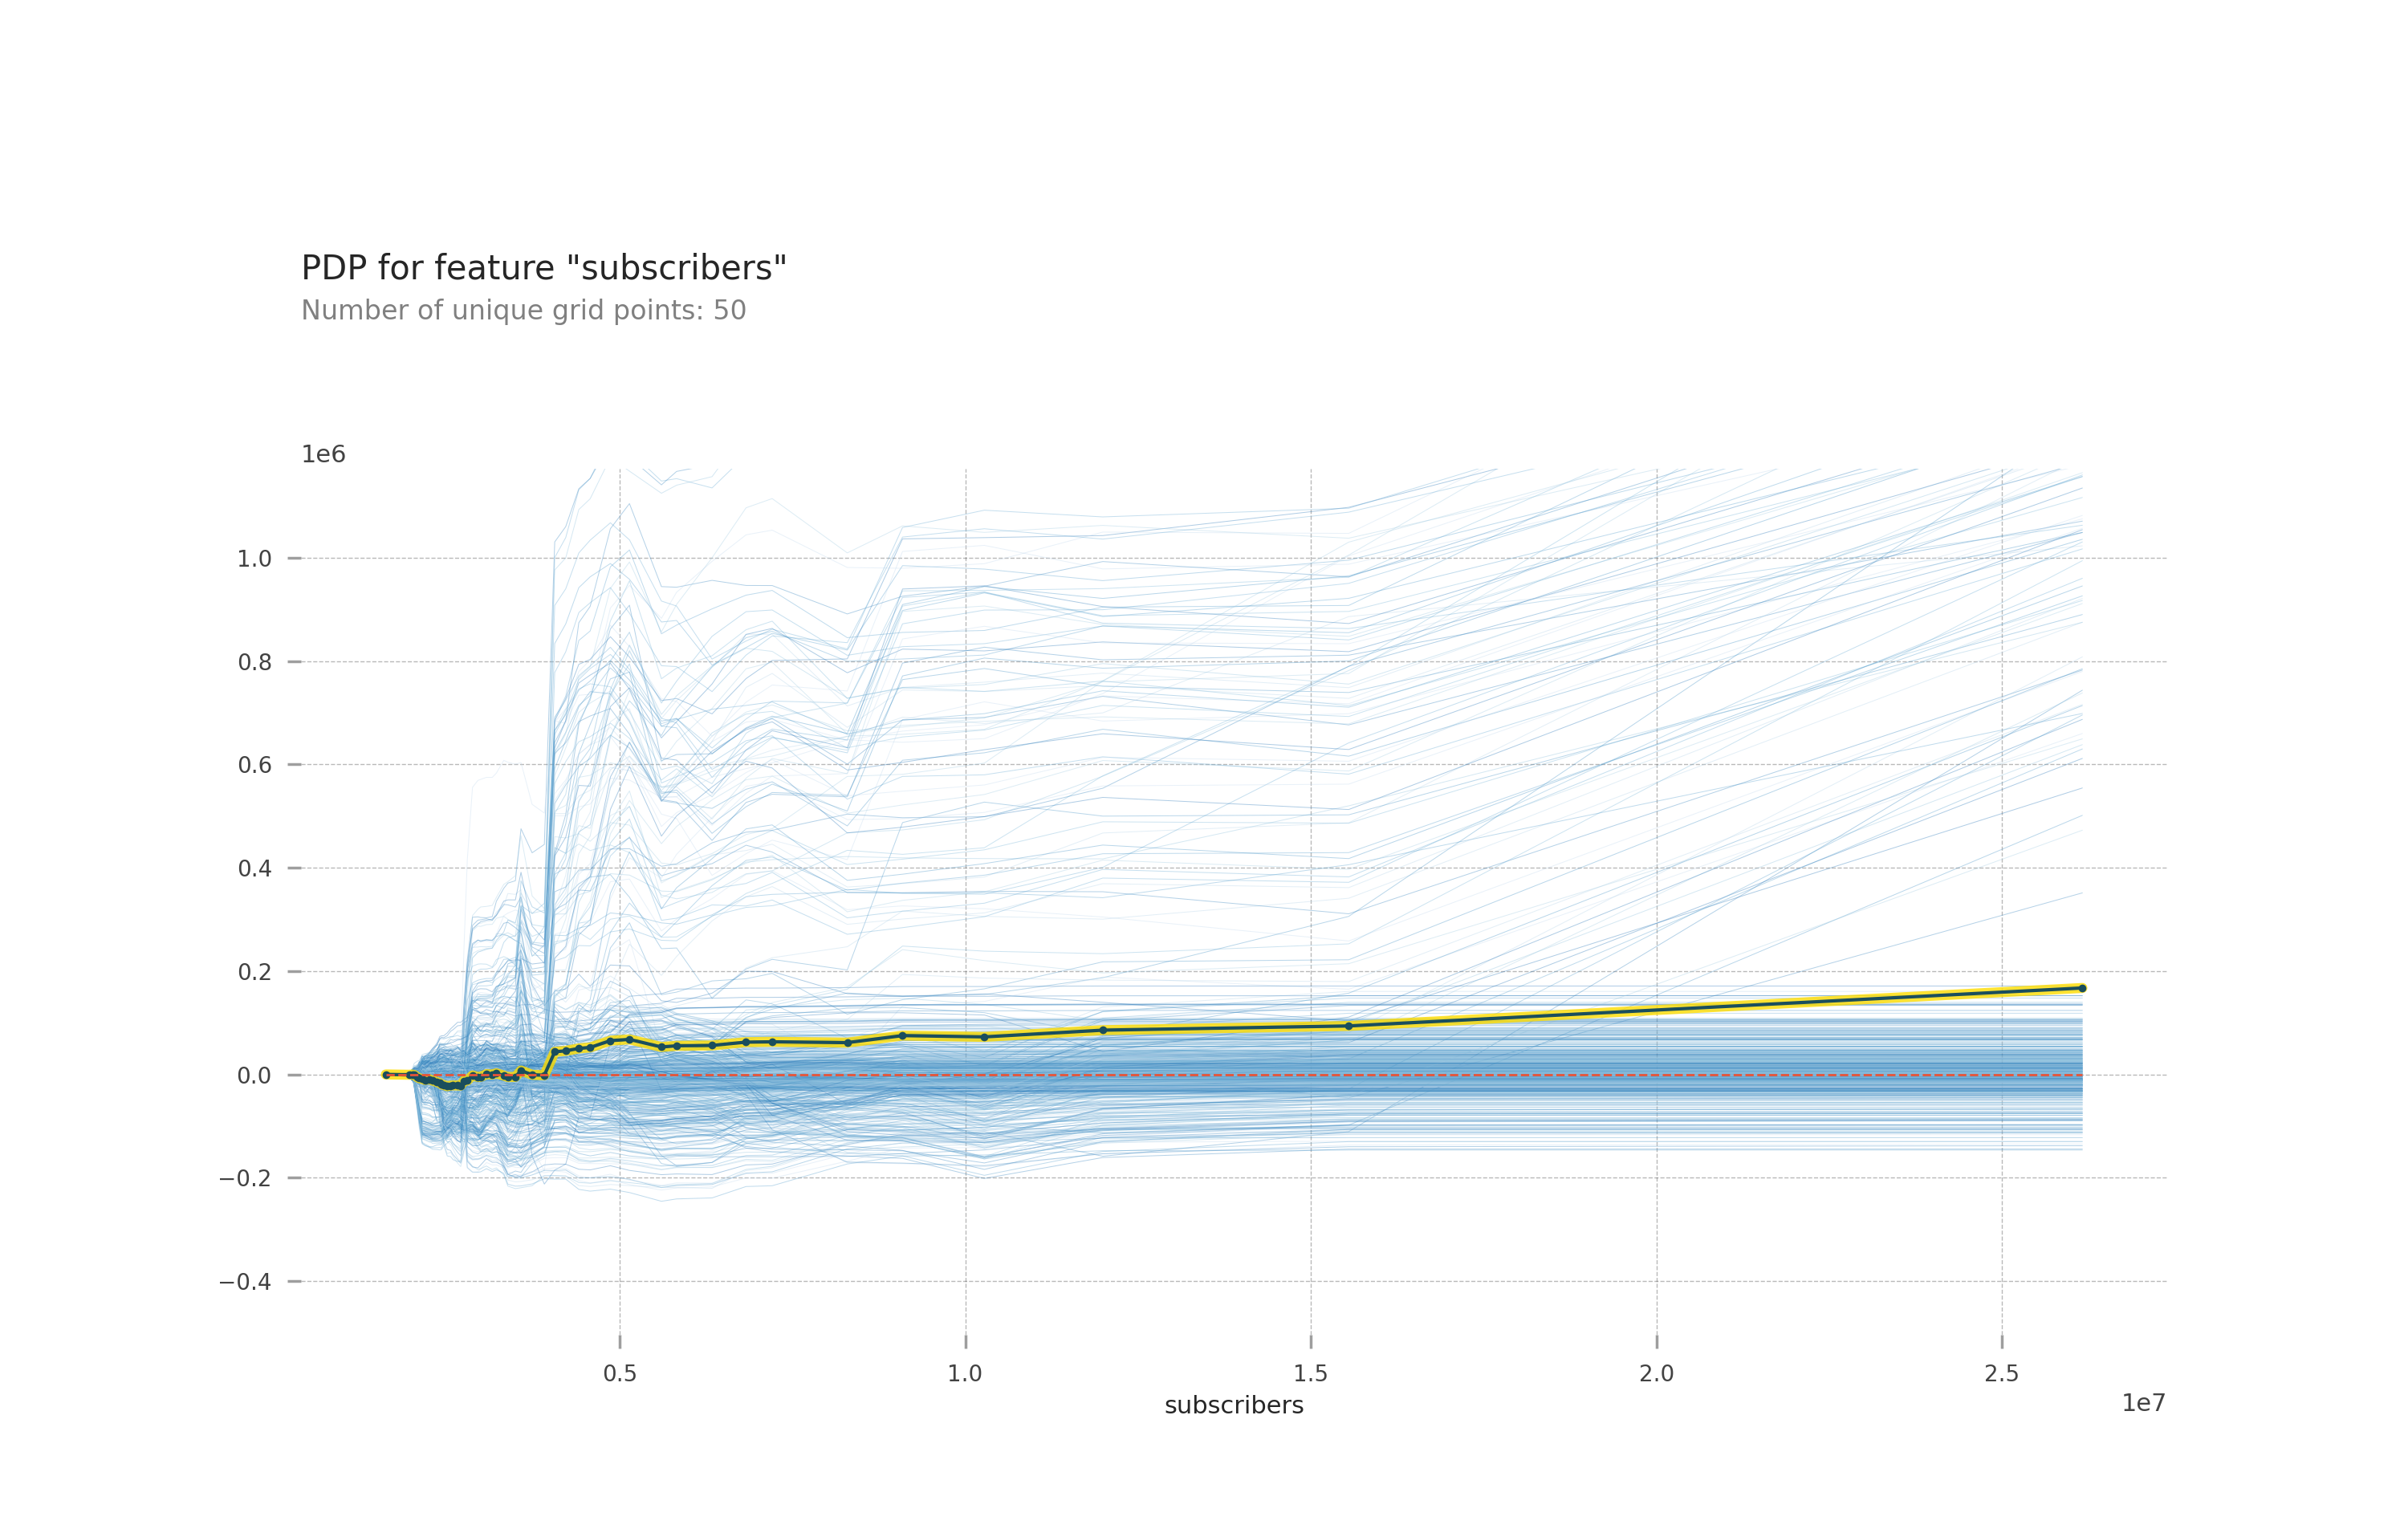
I would have thought subscribers would have the most impact on my model, but, it was actually the grade of the channel that had the most impact.
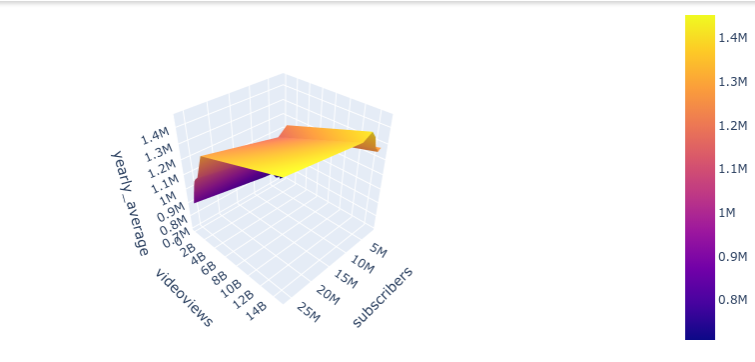
Comparing video views and subscribers gave me lots of insight into the model. These were the top two things I thought would impact my model the most.
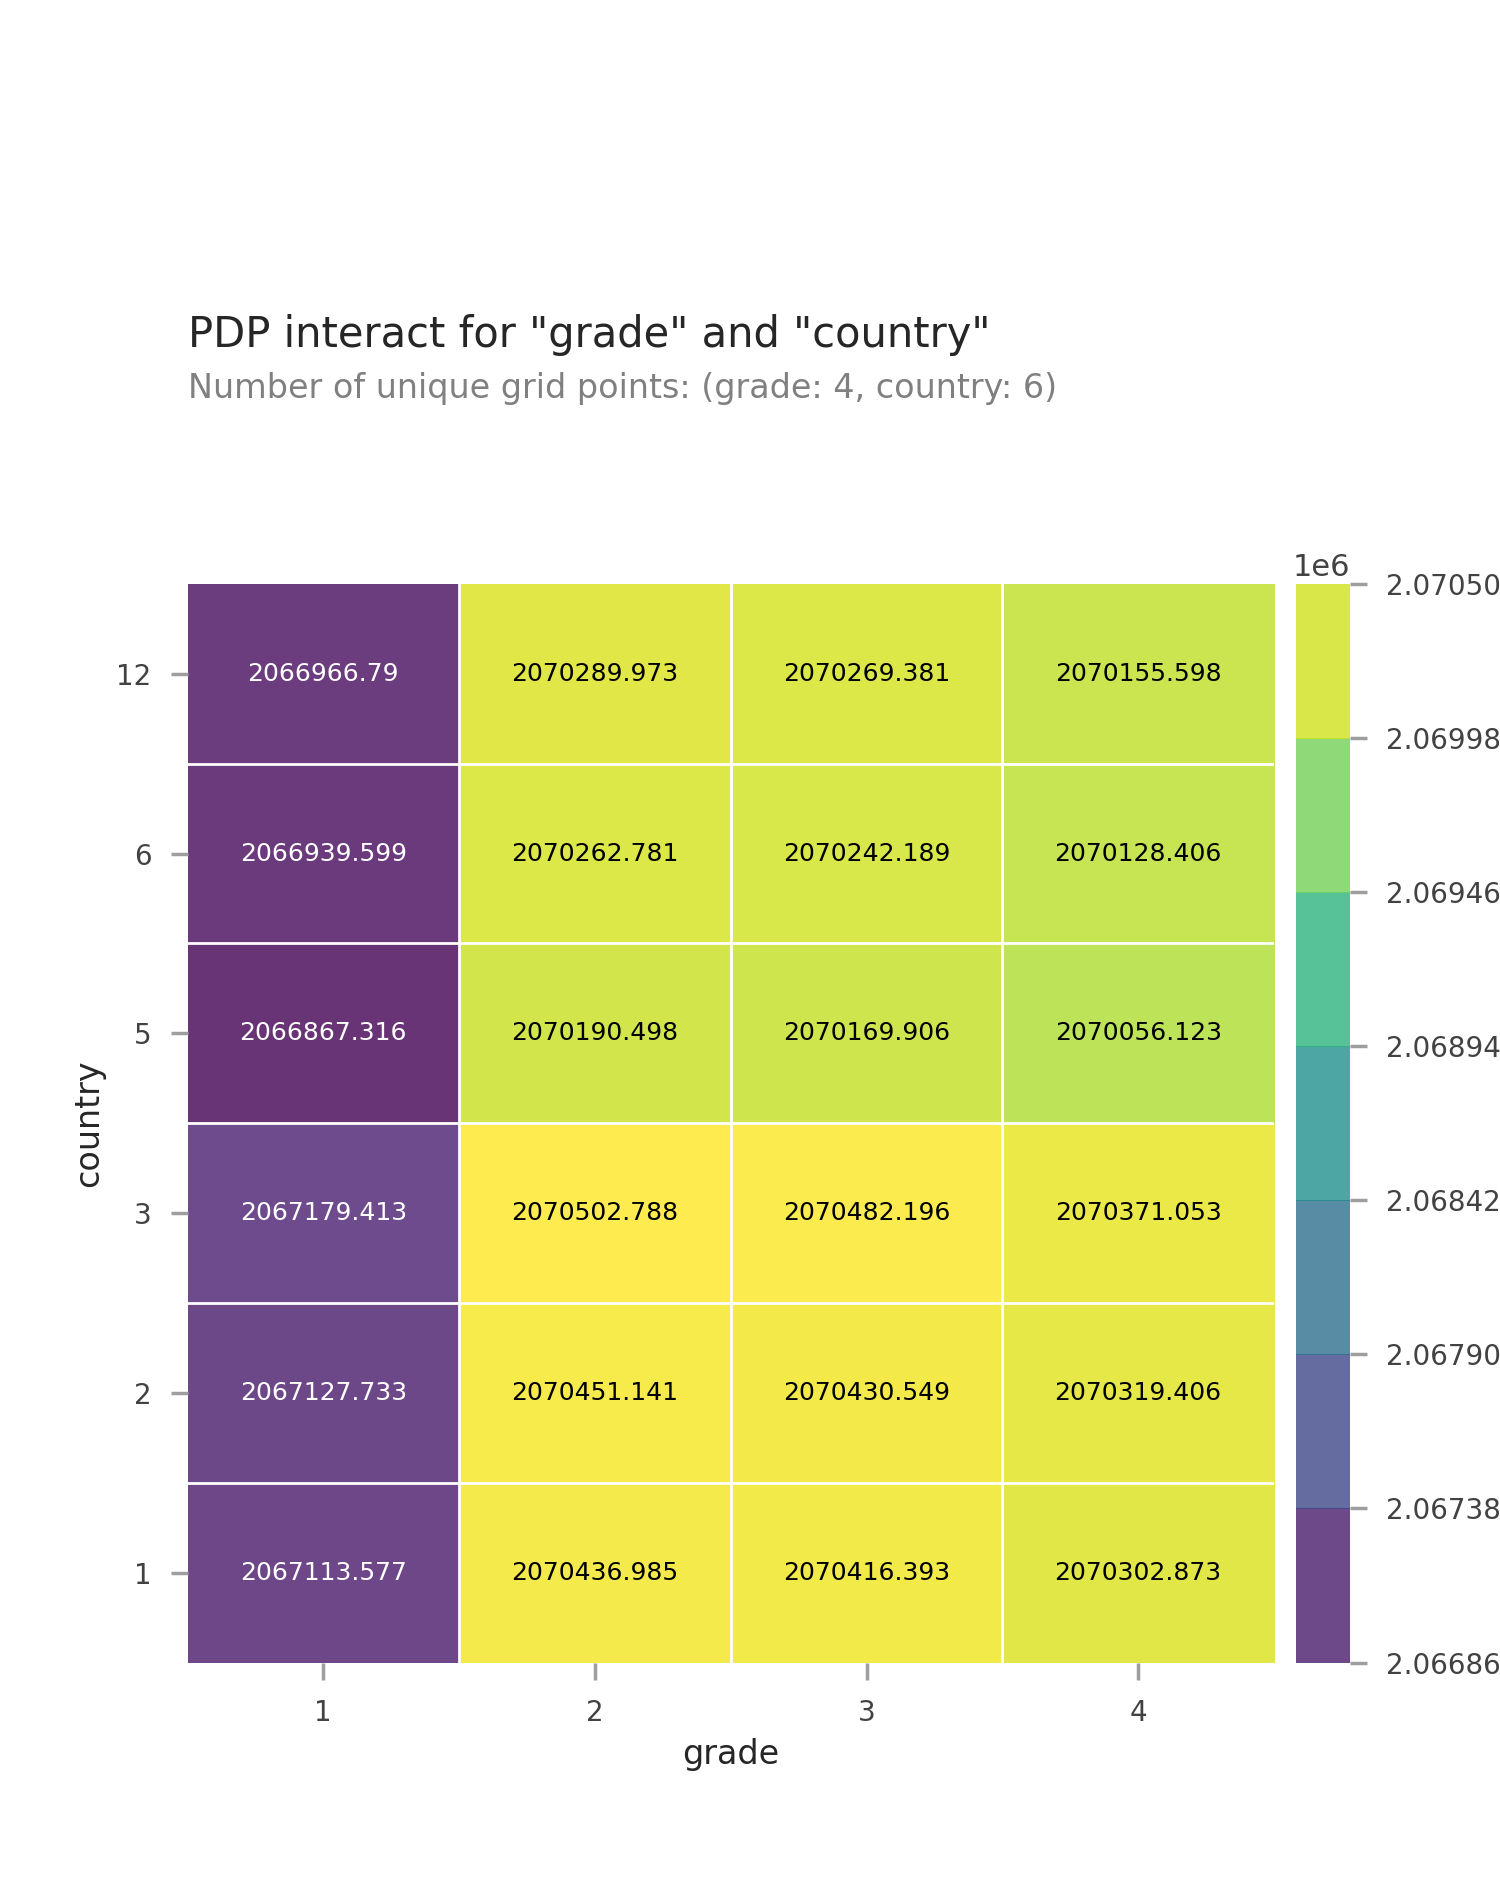
The country of origin didn’t have as much impact as I would have expected either. Especially after comparing it with the grade of the channel.
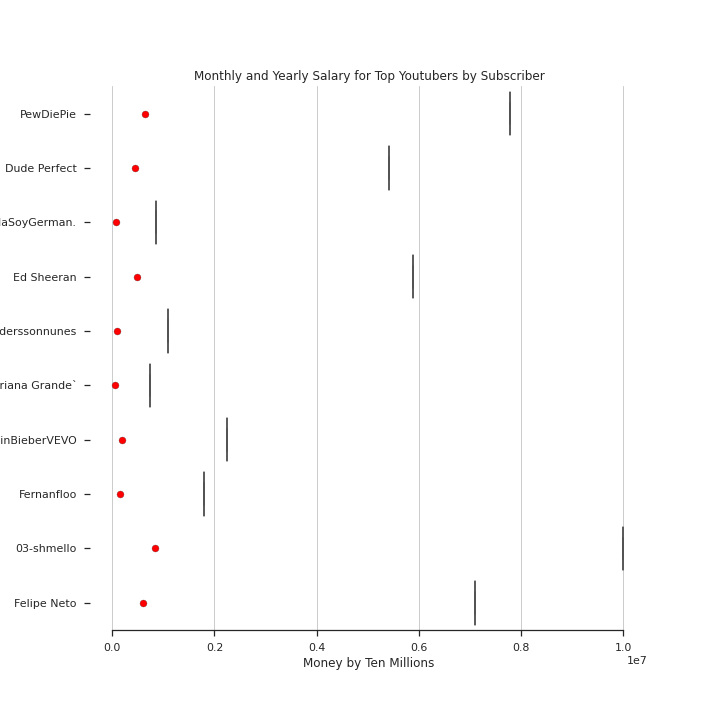
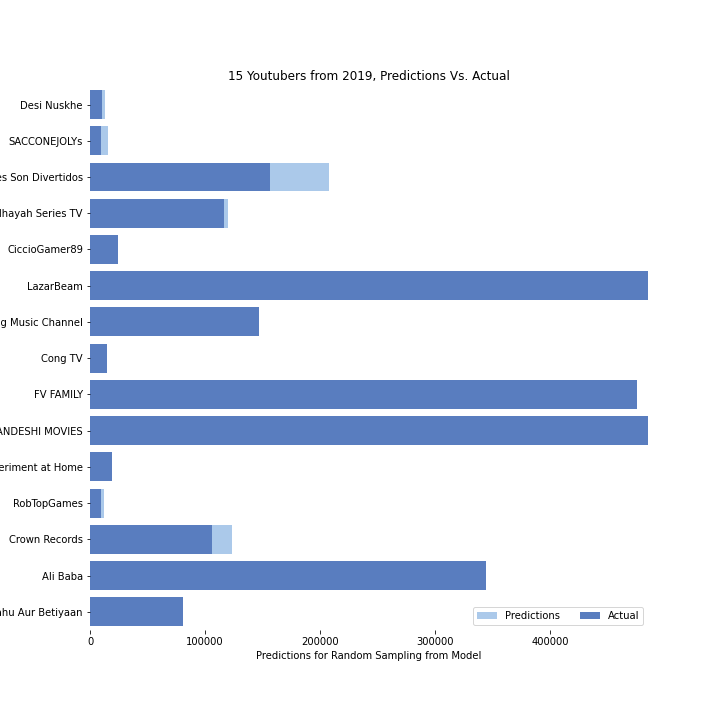
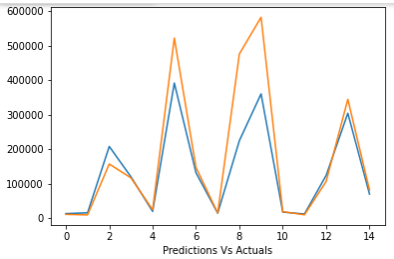
Graphs of Predicted Values Vs. Actual Values
Line graphing actual and predicted monthly values
.png?raw=true)
Bar Graph(Actual and Predicted Yearly Average Salaries)
Plot Graph(Actual and Predicted Monthly Salary Averages)
Results
Youtuber’s work hard and the hard work pays off. I’m looking forward to getting the 2020 information and applying my model. Can’t wait to see how close I am to the actual salaries this year for Youtuber’s after this pandemic. I really have to say that building this model gave me tons of insight into Youtuber’s and why they do what they do.
Code
Here’s is my data wrangling code: —
def data_wrangle(X):
X=X.copy()
#columns to be deleted(high cardinality)
        deleted=['web-scraper-order','web-scraper-start-url','userID',
           'userID-href','YouTube_Link','YouTube_Link-href',
           'TwitterHandle','TwitterHandle-href','InstagramHandle',
           'InstagramHandle-href']
        X=X.drop(columns=deleted)

#split columns from ranges into seperate columns
  X[['monthly_lower_range','monthly_higher_range']]=X.MonthlyEarnings.str.split("-",expand=True)
  X[['yearly_lower_range','yearly_higher_range']]=X.YearlyEarnings.str.split("-", expand=True)

  #delete original columns
  wages=['MonthlyEarnings','YearlyEarnings']
  X=X.drop(columns=wages)

  #Delete Dollar Sign
  col_with_dollar=['monthly_lower_range','monthly_higher_range',
                   'yearly_lower_range','yearly_higher_range']
  for col in col_with_dollar:
      X[col] = X[col].str.replace('$', '')

  #Replace K with two zeros (all values are in decimals form)
  #Example 1.1k
  col_with_k=['monthly_lower_range','monthly_higher_range',
              'yearly_lower_range','yearly_higher_range']
  for col in col_with_k:
    X[col]=X[col].str.replace('K','00')

  #Replace all M with 5 zeros (all values are in decimal form)
  #Example 1.3M
  col_with_m=['monthly_lower_range','monthly_higher_range',
              'yearly_lower_range','yearly_higher_range']
  for col in col_with_m:
    X[col]=X[col].str.replace('M','00000')

  #Remove Decimals
  col_with_decimal=['monthly_lower_range','monthly_higher_range',
                    'yearly_lower_range','yearly_higher_range']
  for col in col_with_decimal:
    X[col]=X[col].str.replace('.','')

  #Covert from Euro to Dollar (database was in Euros)
  col_convert=['monthly_lower_range','monthly_higher_range',
               'yearly_lower_range','yearly_higher_range']
  for col in col_convert:
    X[col]=X[col].astype(float)*1.08

  #Add two new columns (averages for year and month)
  X['yearly_average']=X.yearly_lower_range + X.yearly_higher_range/ 2
  X['monthly_average']=X.yearly_average/12

  #Take out low outliers
  X=X[X['monthly_lower_range']>1000]
  X=X[X['yearly_lower_range']>0]

  #use top ten of the channel types to reduce cardinality
  top10=X['channeltype'].value_counts()[:10].index
  X.loc[~X['channeltype'].isin(top10),'channeltype']=='Other'

  #Covert user created to datetime, to retrieve year
  #then delete date column
  X['usercreated']=pd.to_datetime(X['usercreated'])
  X['yearcreated']=X['usercreated'].dt.year
  X=X.drop(columns='usercreated')

  #set index to the name
  #for future predictions
  X=X.set_index(keys='name')
  return X